Background
Every time you flip a light switch, somewhere on the grid a generator responds instantly.
Electricity is unique among commodities. Supply (generation) must match demand (consumption) continuously and in real time. Although storage technology is improving rapidly, grid-scale storage capacity remains limited, so we can’t simply generate electricity ahead of time and dispatch it when needed. The challenging coordination required to balance the grid and avoid undergeneration or overgeneration makes understanding the dynamics of demand especially important. If supply doesn’t meet demand, the result can be blackouts or equipment damage.
While electricity demand ebbs and flows, responds to the weather, and is subject to shifts in human behavior, there are many repeated patterns and cycles. We’ll use California as a case study with real-world data from the California Independent System Operator (CAISO), examining daily and seasonal patterns and the drivers behind them. CAISO is an Independent System Operator (ISO), responsible for managing the transmission grid and wholesale electricity markets for most of California. ISOs play a key role in ensuring grid reliability by balancing supply and demand.
Note: I’ll be using the term load, which refers to the total power being drawn from the grid at a given time, in place of demand. Load and demand are closely related and often used interchangeably but load is the more precise term in this context. Load will be measured in megawatts (MW), representing power drawn at a given instant.
Seasonal Cycle
Let’s start with a birds-eye view of the three-year span between January 2022 and December 2024. We already see some interesting seasonal patterns. Fall, winter, and spring are relatively stable periods of lower load, compared to the dramatic increases seen during the summer.
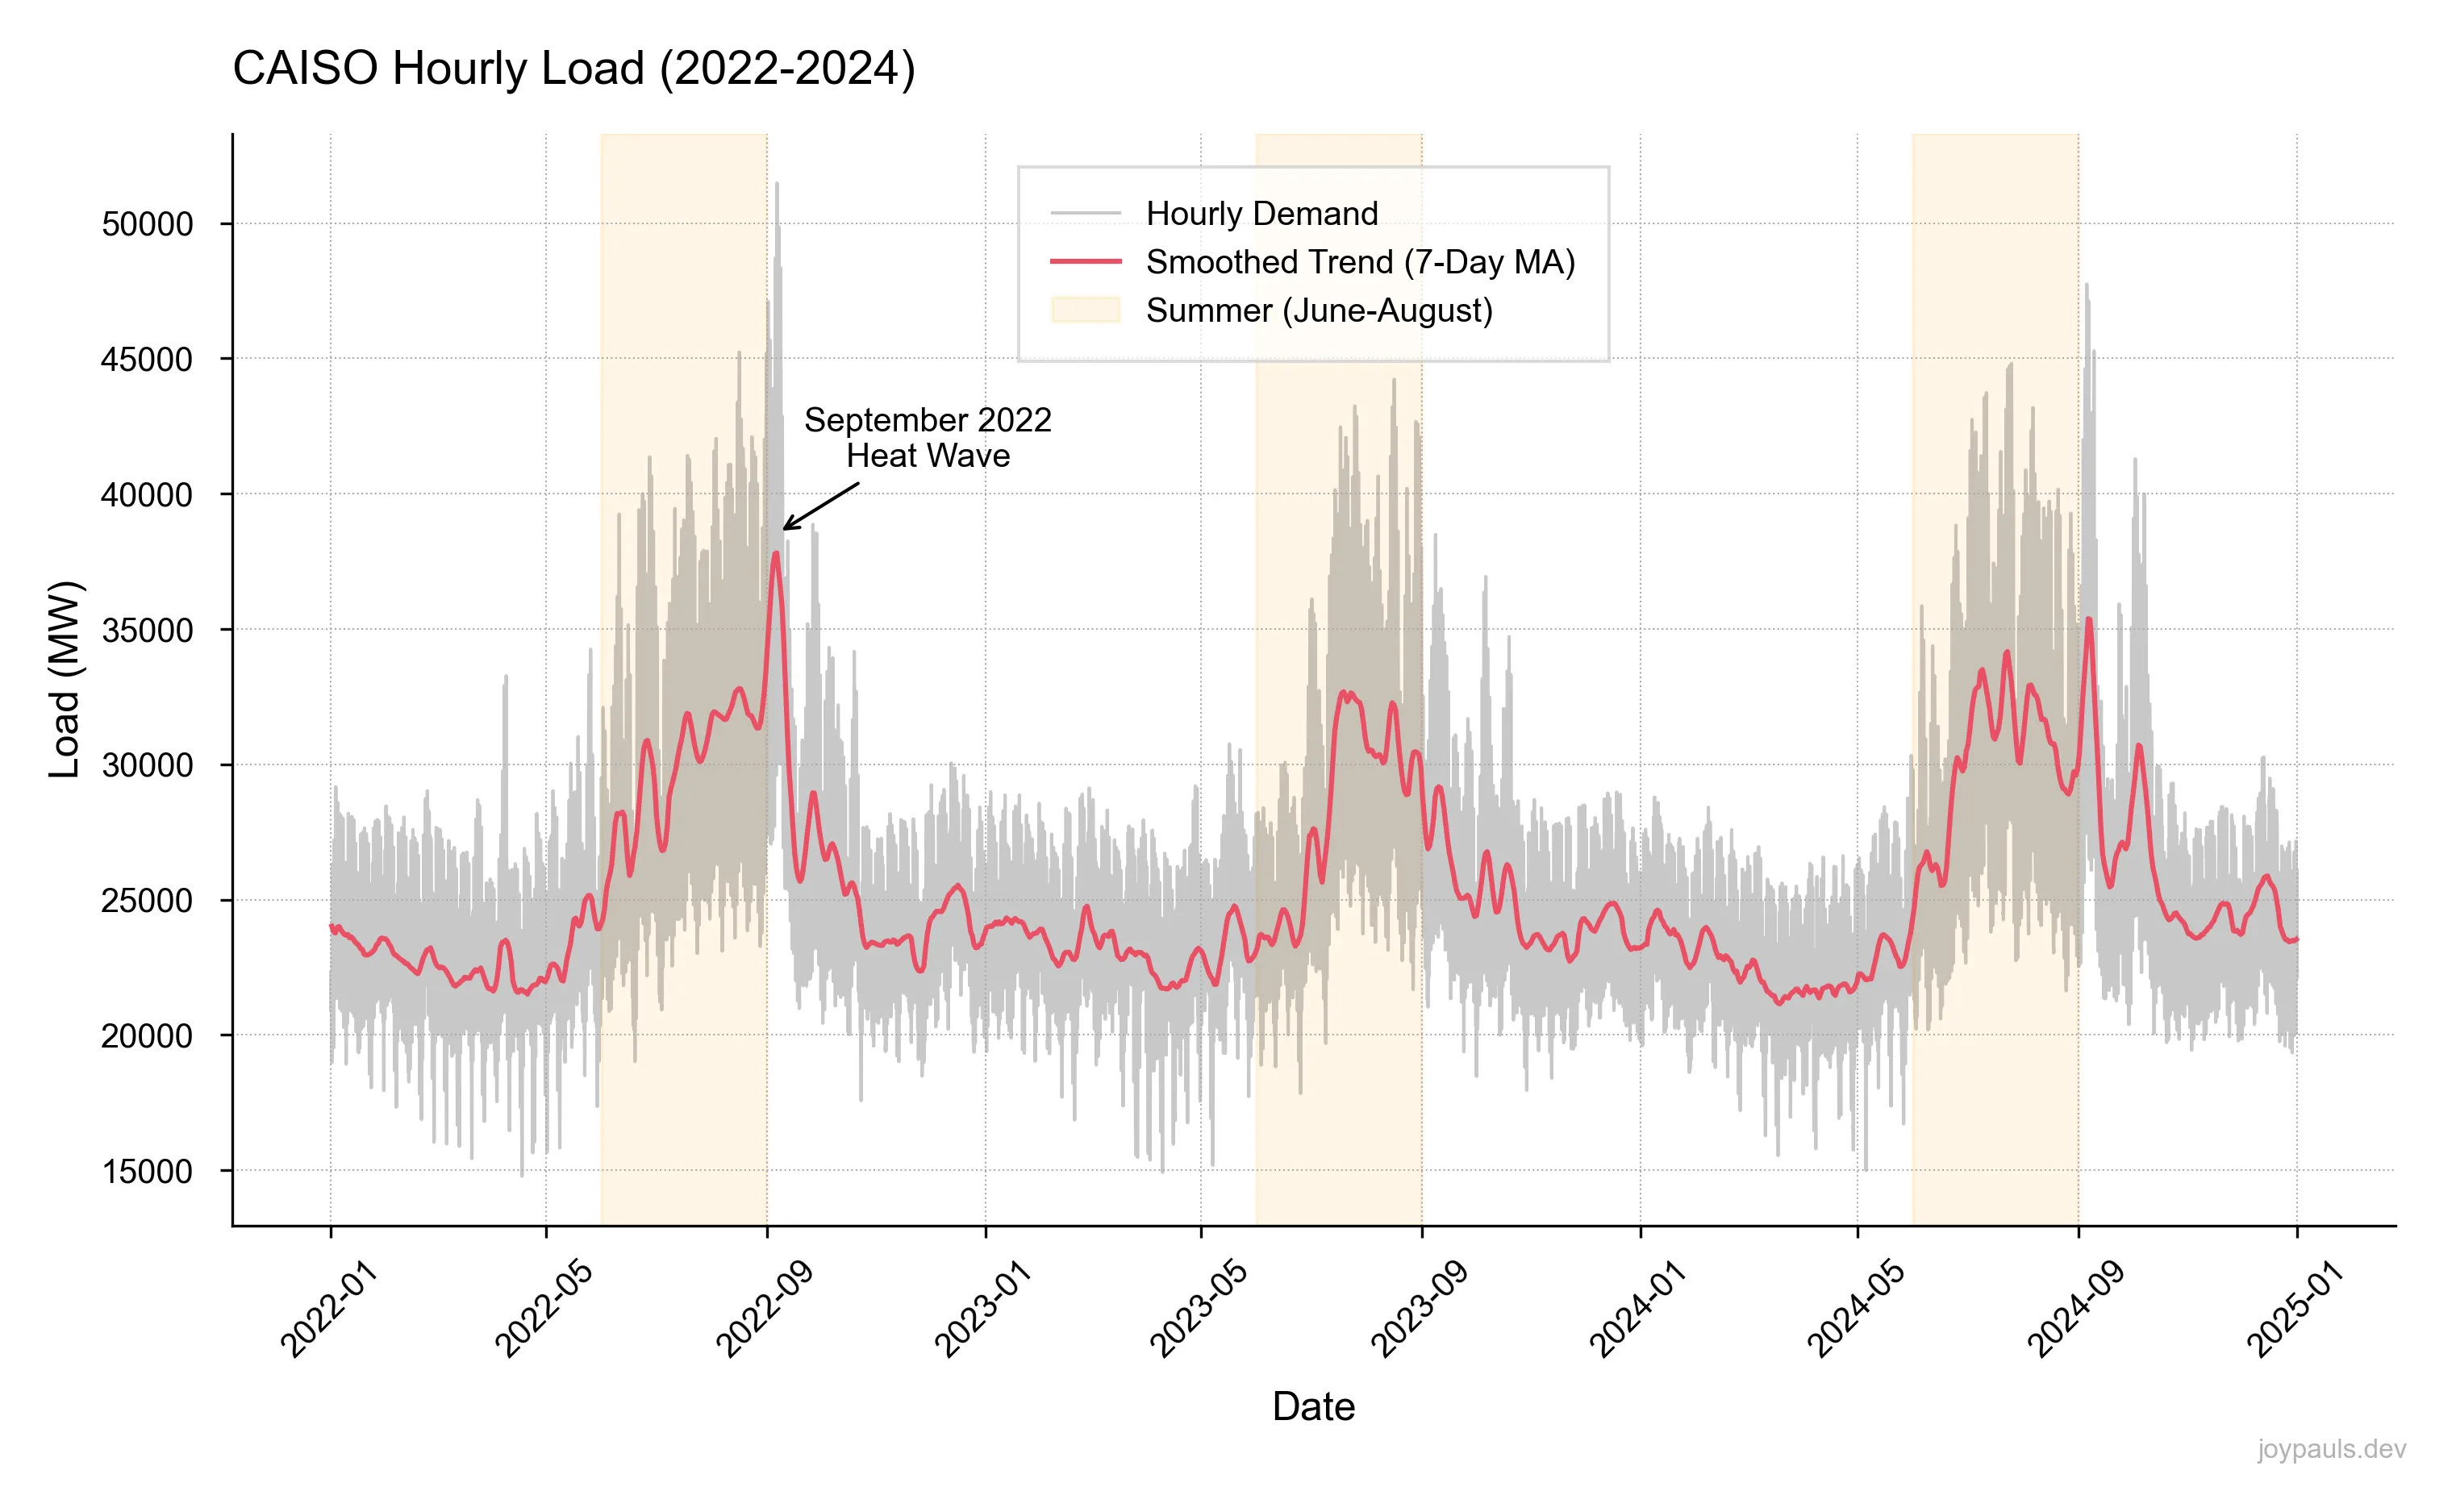
Why the spike in the summer? Residential, commercial, and industrial cooling. Air conditioners are almost universally powered by electricity, while in California it’s more common for space heating to be powered by natural gas. That means that cold weather contributes less to winter load than hot weather does for summer.
One important implication is that weather and temperature have huge impacts on the grid in warmer months. We can see that quite clearly in the data; in September 2022, a record-breaking heat wave caused system-wide load to spike to its highest peak during this period.
Zooming into a single year (2024), we get a better view of these dynamics.
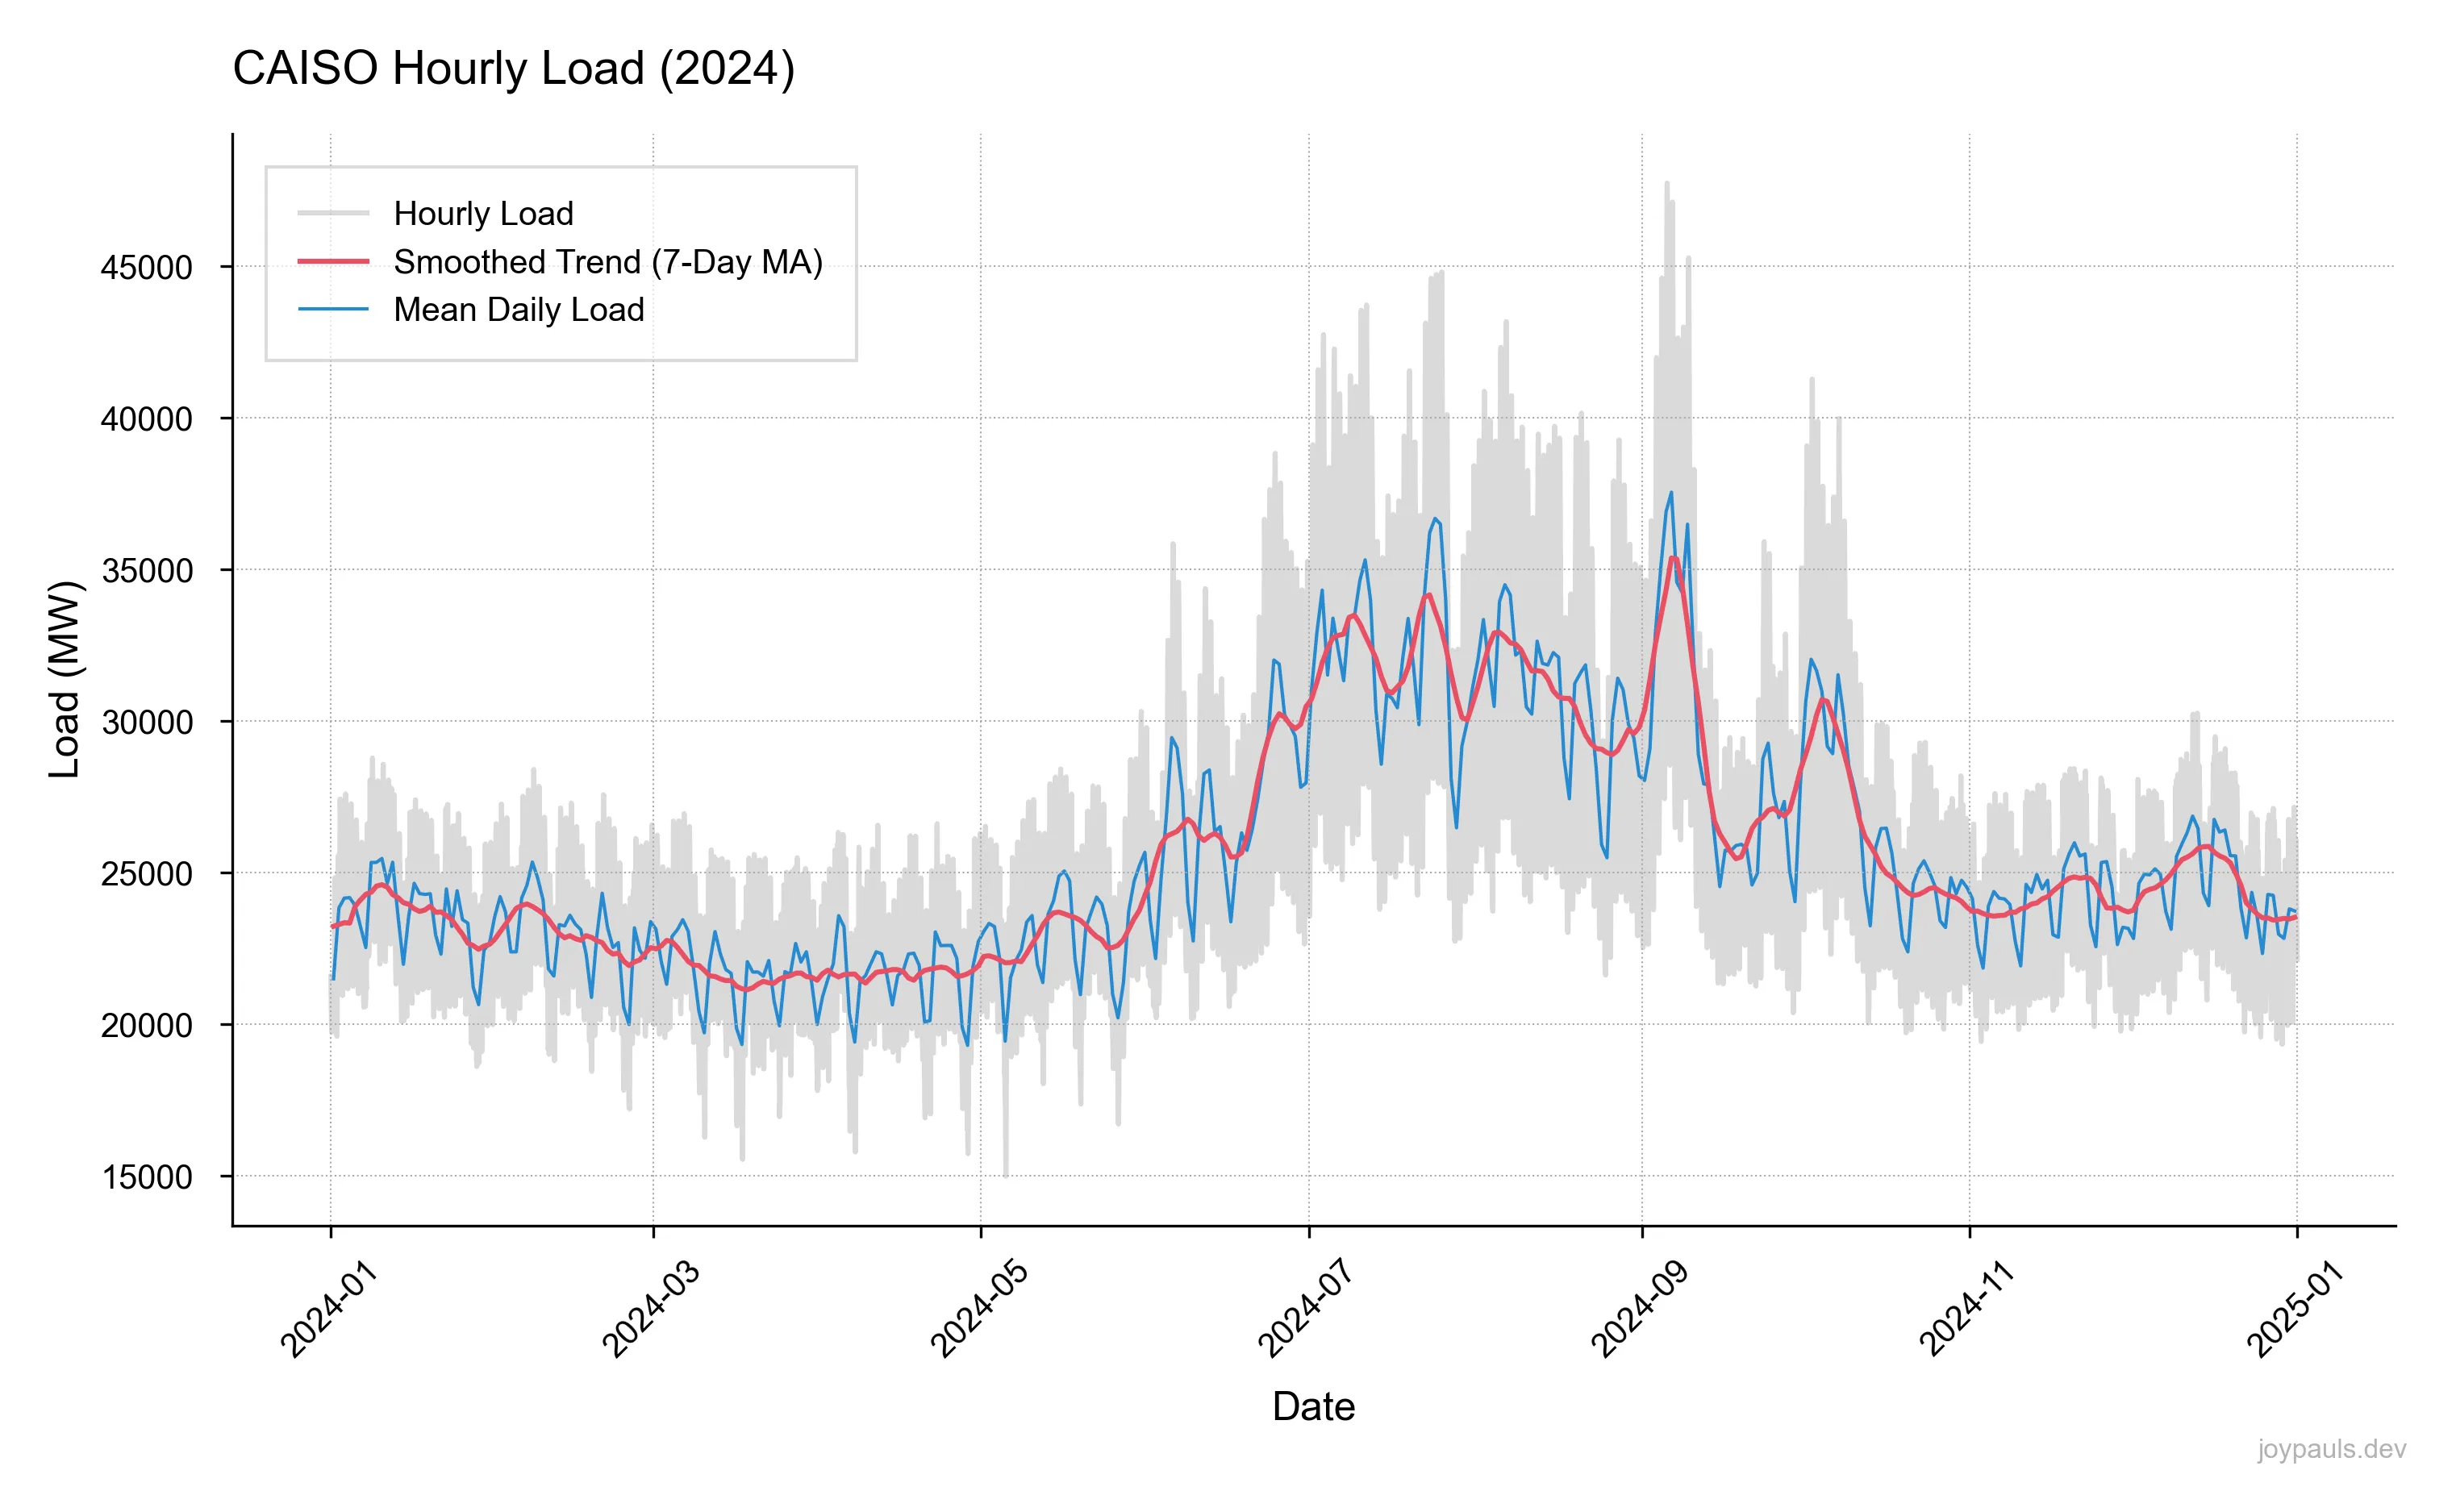
Comparing the smoothed trend to the daily averages and the raw hourly load tells us that there is significant variation beyond the annual seasonal cycle. Day-to-day averages exhibit their own cyclicality that the smoothed trend glosses over, while the raw hourly load itself appears chaotic and random. We’ll see soon that there are explainable patterns behind all of this, however.
Weekly Cycle
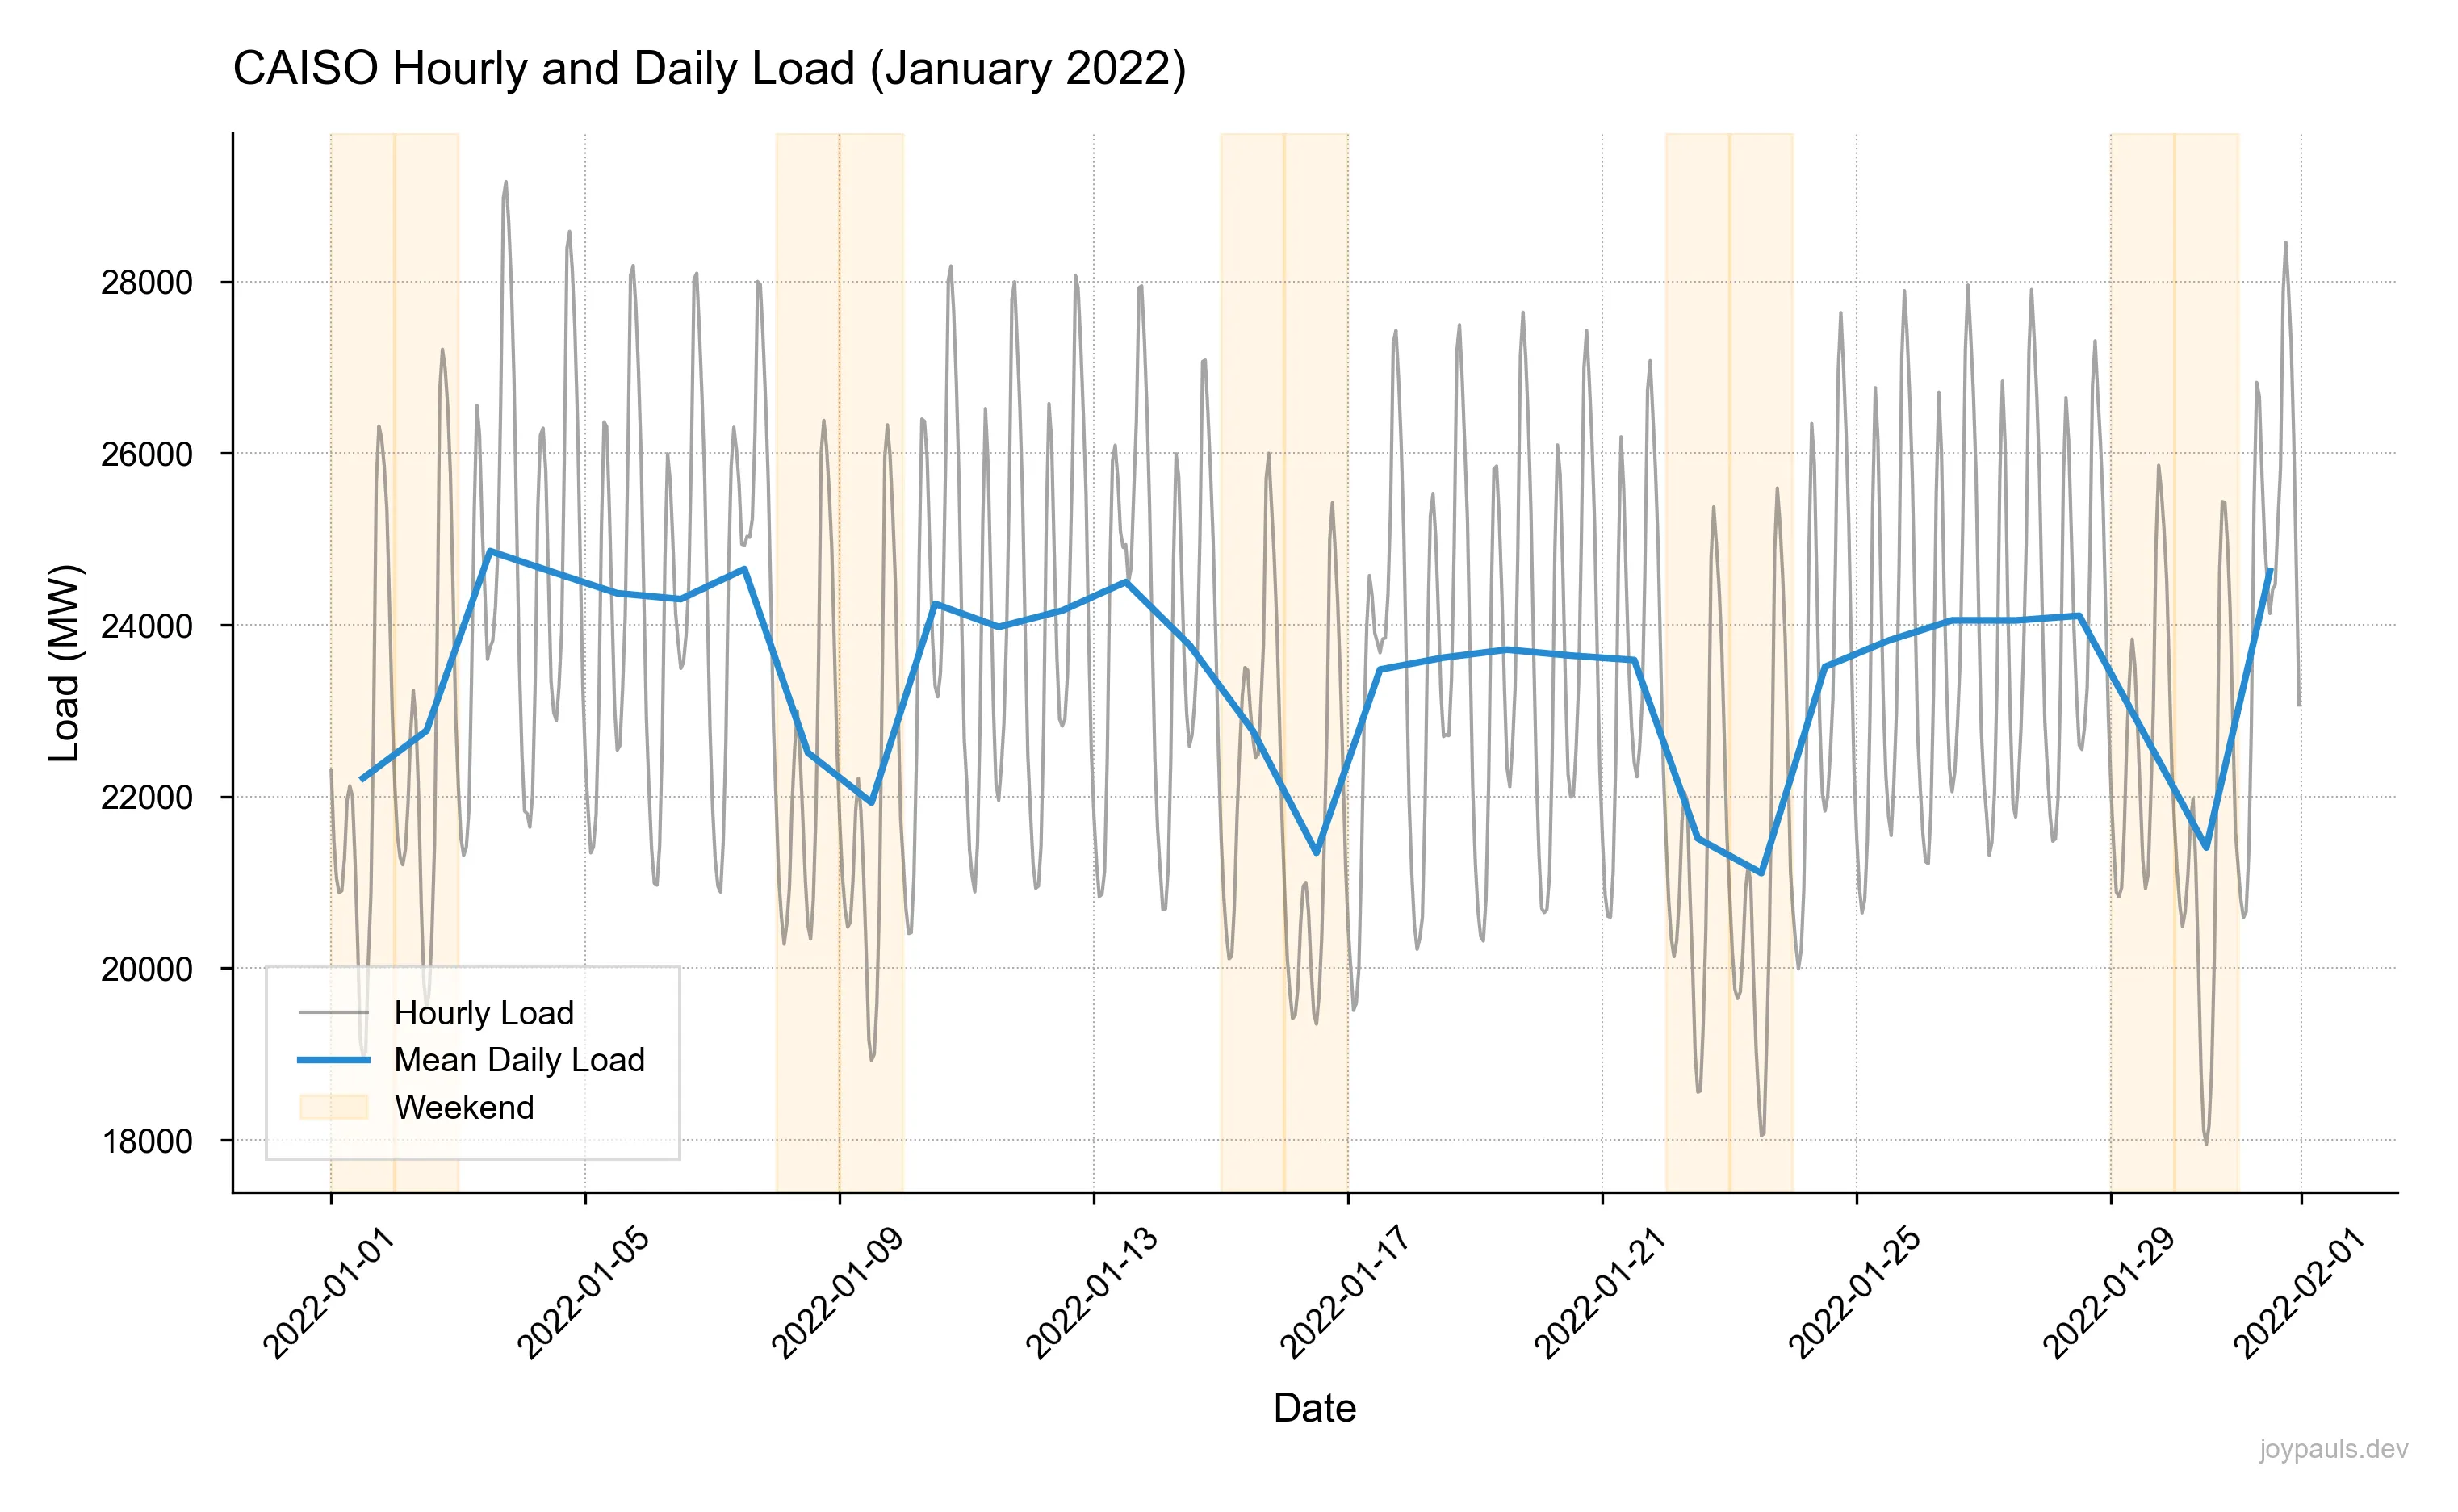
What’s happening at the weekly level is clear when we zoom in even further to look at one month of data. Day-to-day load is influenced by a variety of factors, but weekend loads tend to be lower than weekday loads. The driver behind this is simple: the typical five-day work week means that commercial buildings and businesses see increased electricity usage Monday through Friday while many folks are at work, and pause operations during the weekends.
Daily Load Profiles
Let’s dig into daily patterns, one of the most interesting features of this dataset. A good starting point is the average load at a given hour across the whole year. What does the typical morning look like? What does the typical evening look like? The average daily load profile reflects the rhythm of modern life: when people wake up, go to work, return home, and sleep.
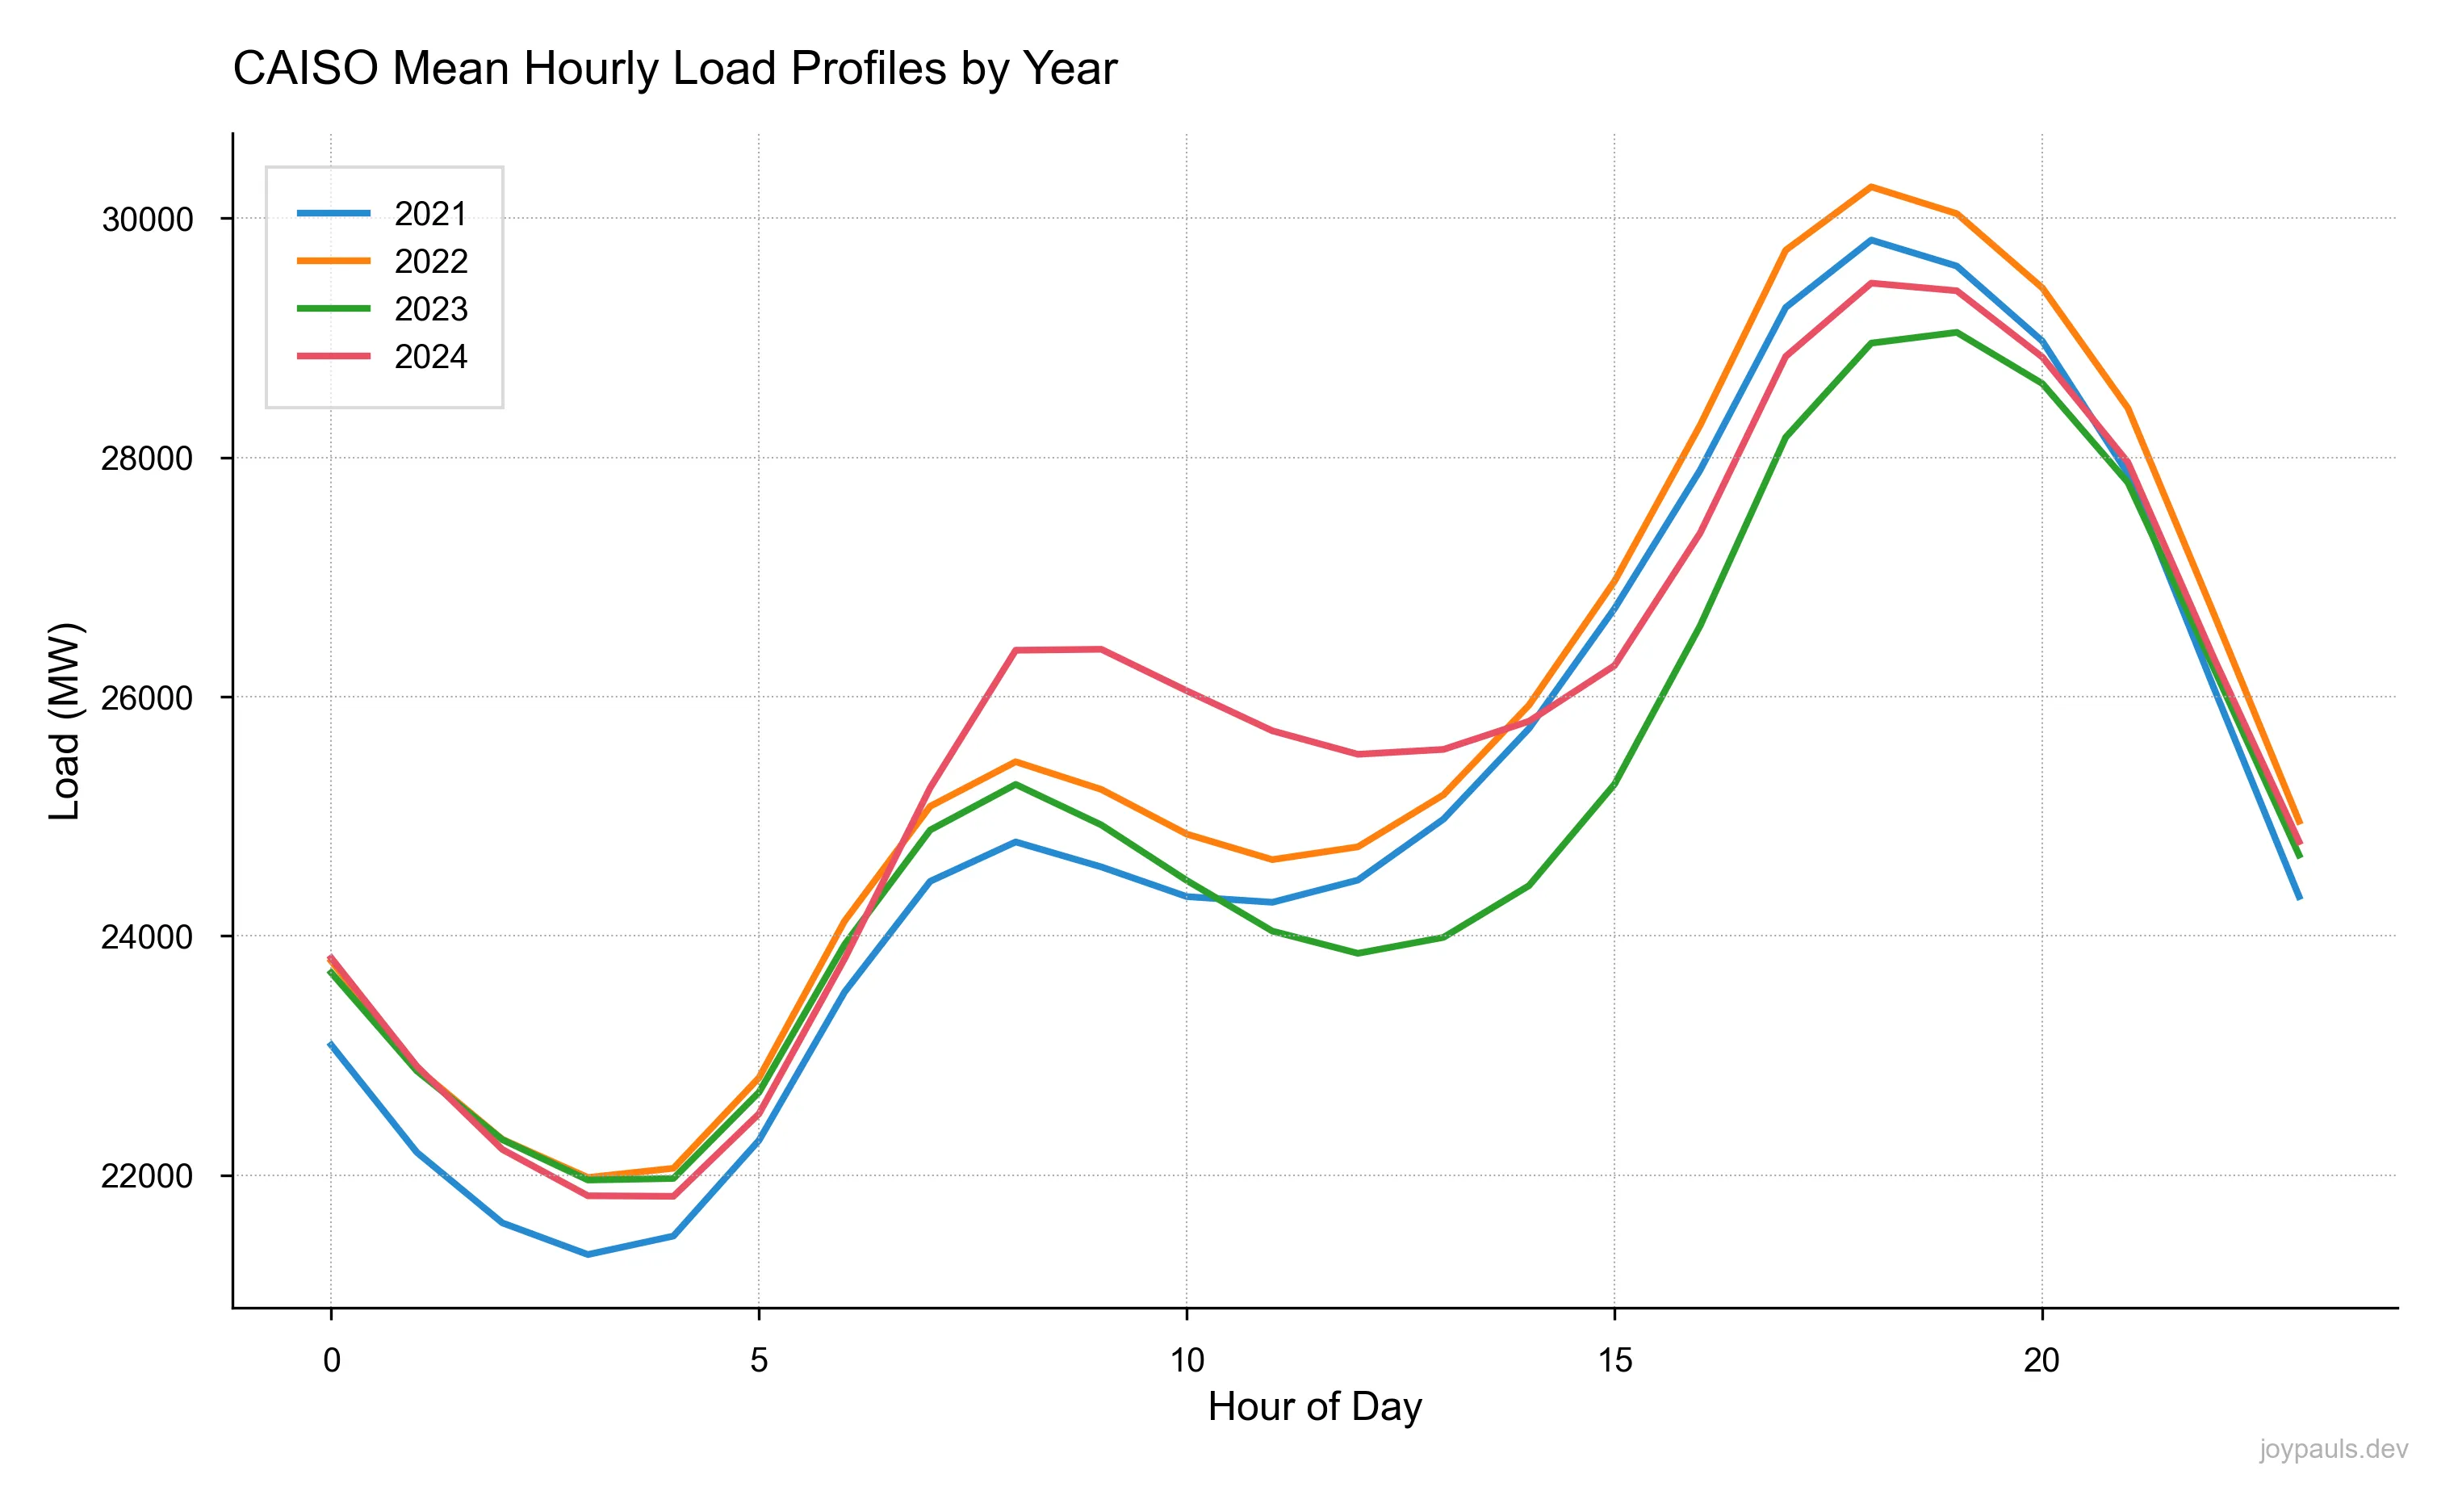
There’s a clear pattern here that persists year to year. The average daily load profile follows a general shape:
-
Morning: As people wake up and start their day, electricity use increases sharply. Residential load rises as people turn on lights, appliances, and heating or cooling systems. Simultaneously, commercial buildings and offices begin operations.
-
Midday: After the morning surge, demand often plateaus or dips slightly during midday hours as residential load declines and commercial load stabilizes.
-
Evening: The most pronounced feature of the load profile is the late afternoon and early evening ramp. People return home, turn on lights, cook, and run appliances, while many commercial buildings remain active.
After the evening peak, demand declines steadily overnight as both residential and commercial activities wind down.
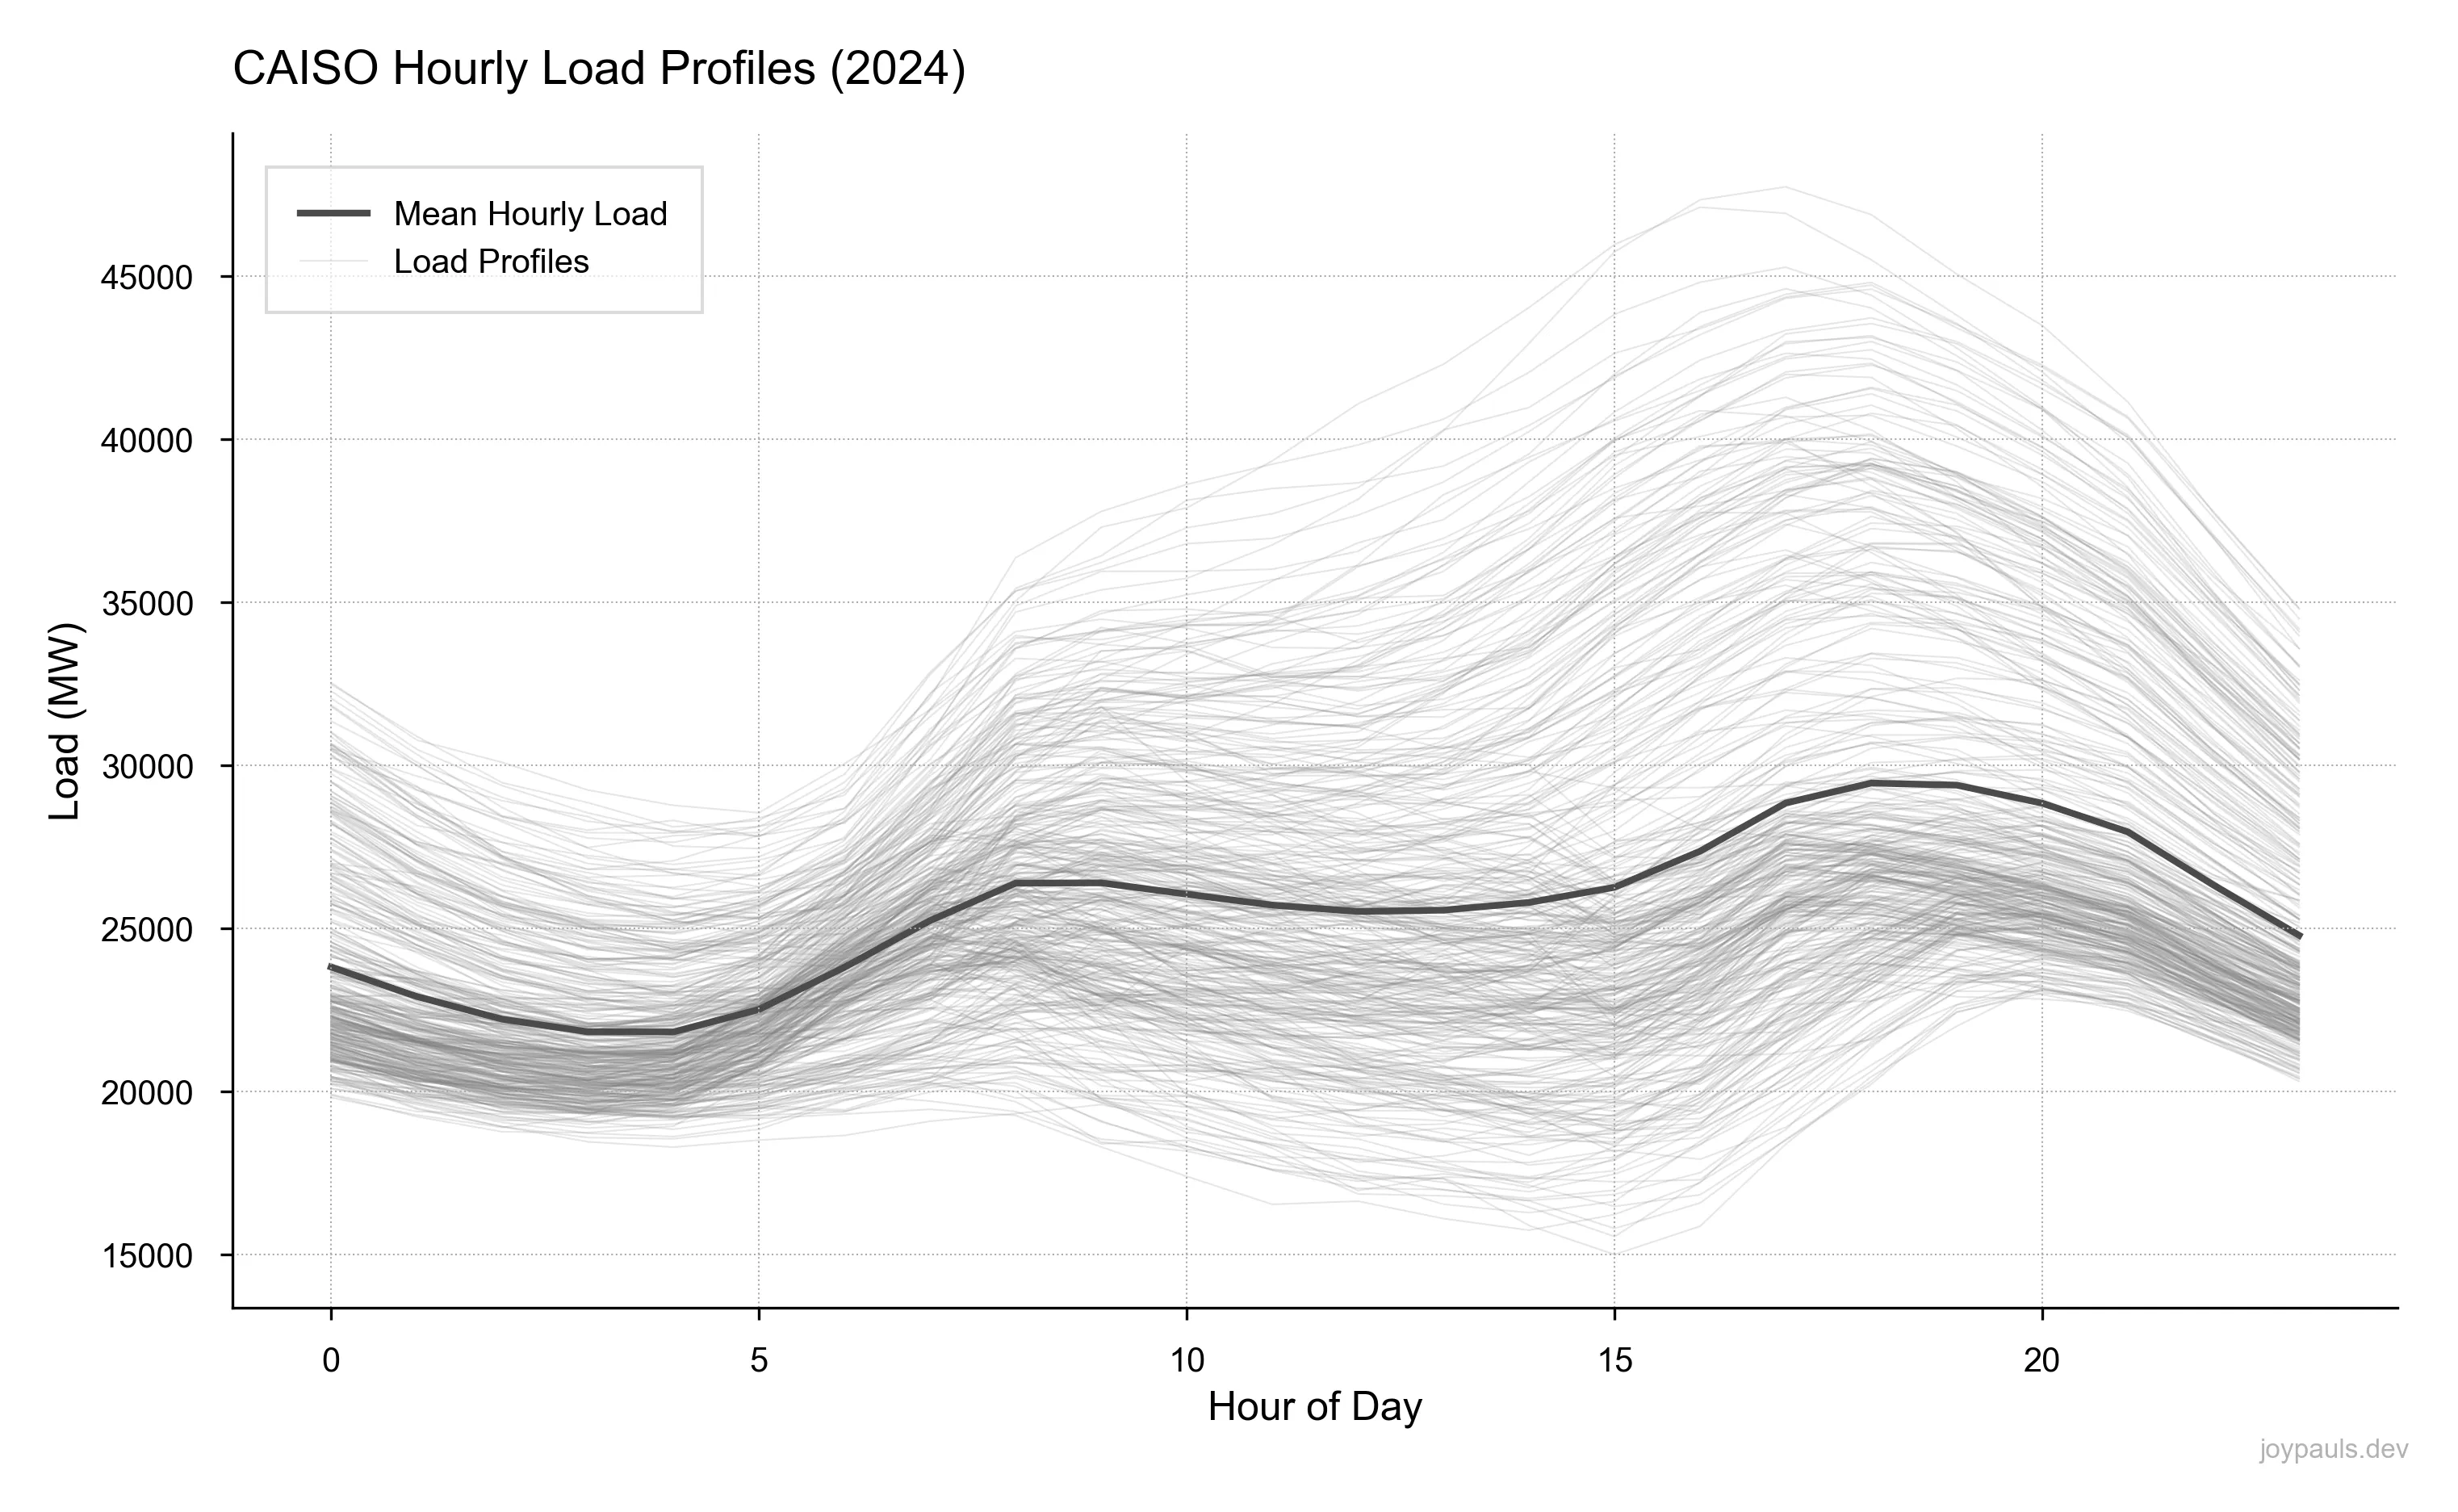
A key question is whether this general shape persists on individual days, or whether it’s simply an artifact of averaging across the year. Below, each thin line represents a daily load profile of 2024, while the thick line is the average across all days of the year. It takes many forms, but the shape is persistent.
Annual and Intra-Day Variability
Let’s put what we’ve discovered so far together to get a holistic picture of how time-of-day and seasonality interact across a full year. In this heatmap, each square represents a month of the year and an hour of the day.
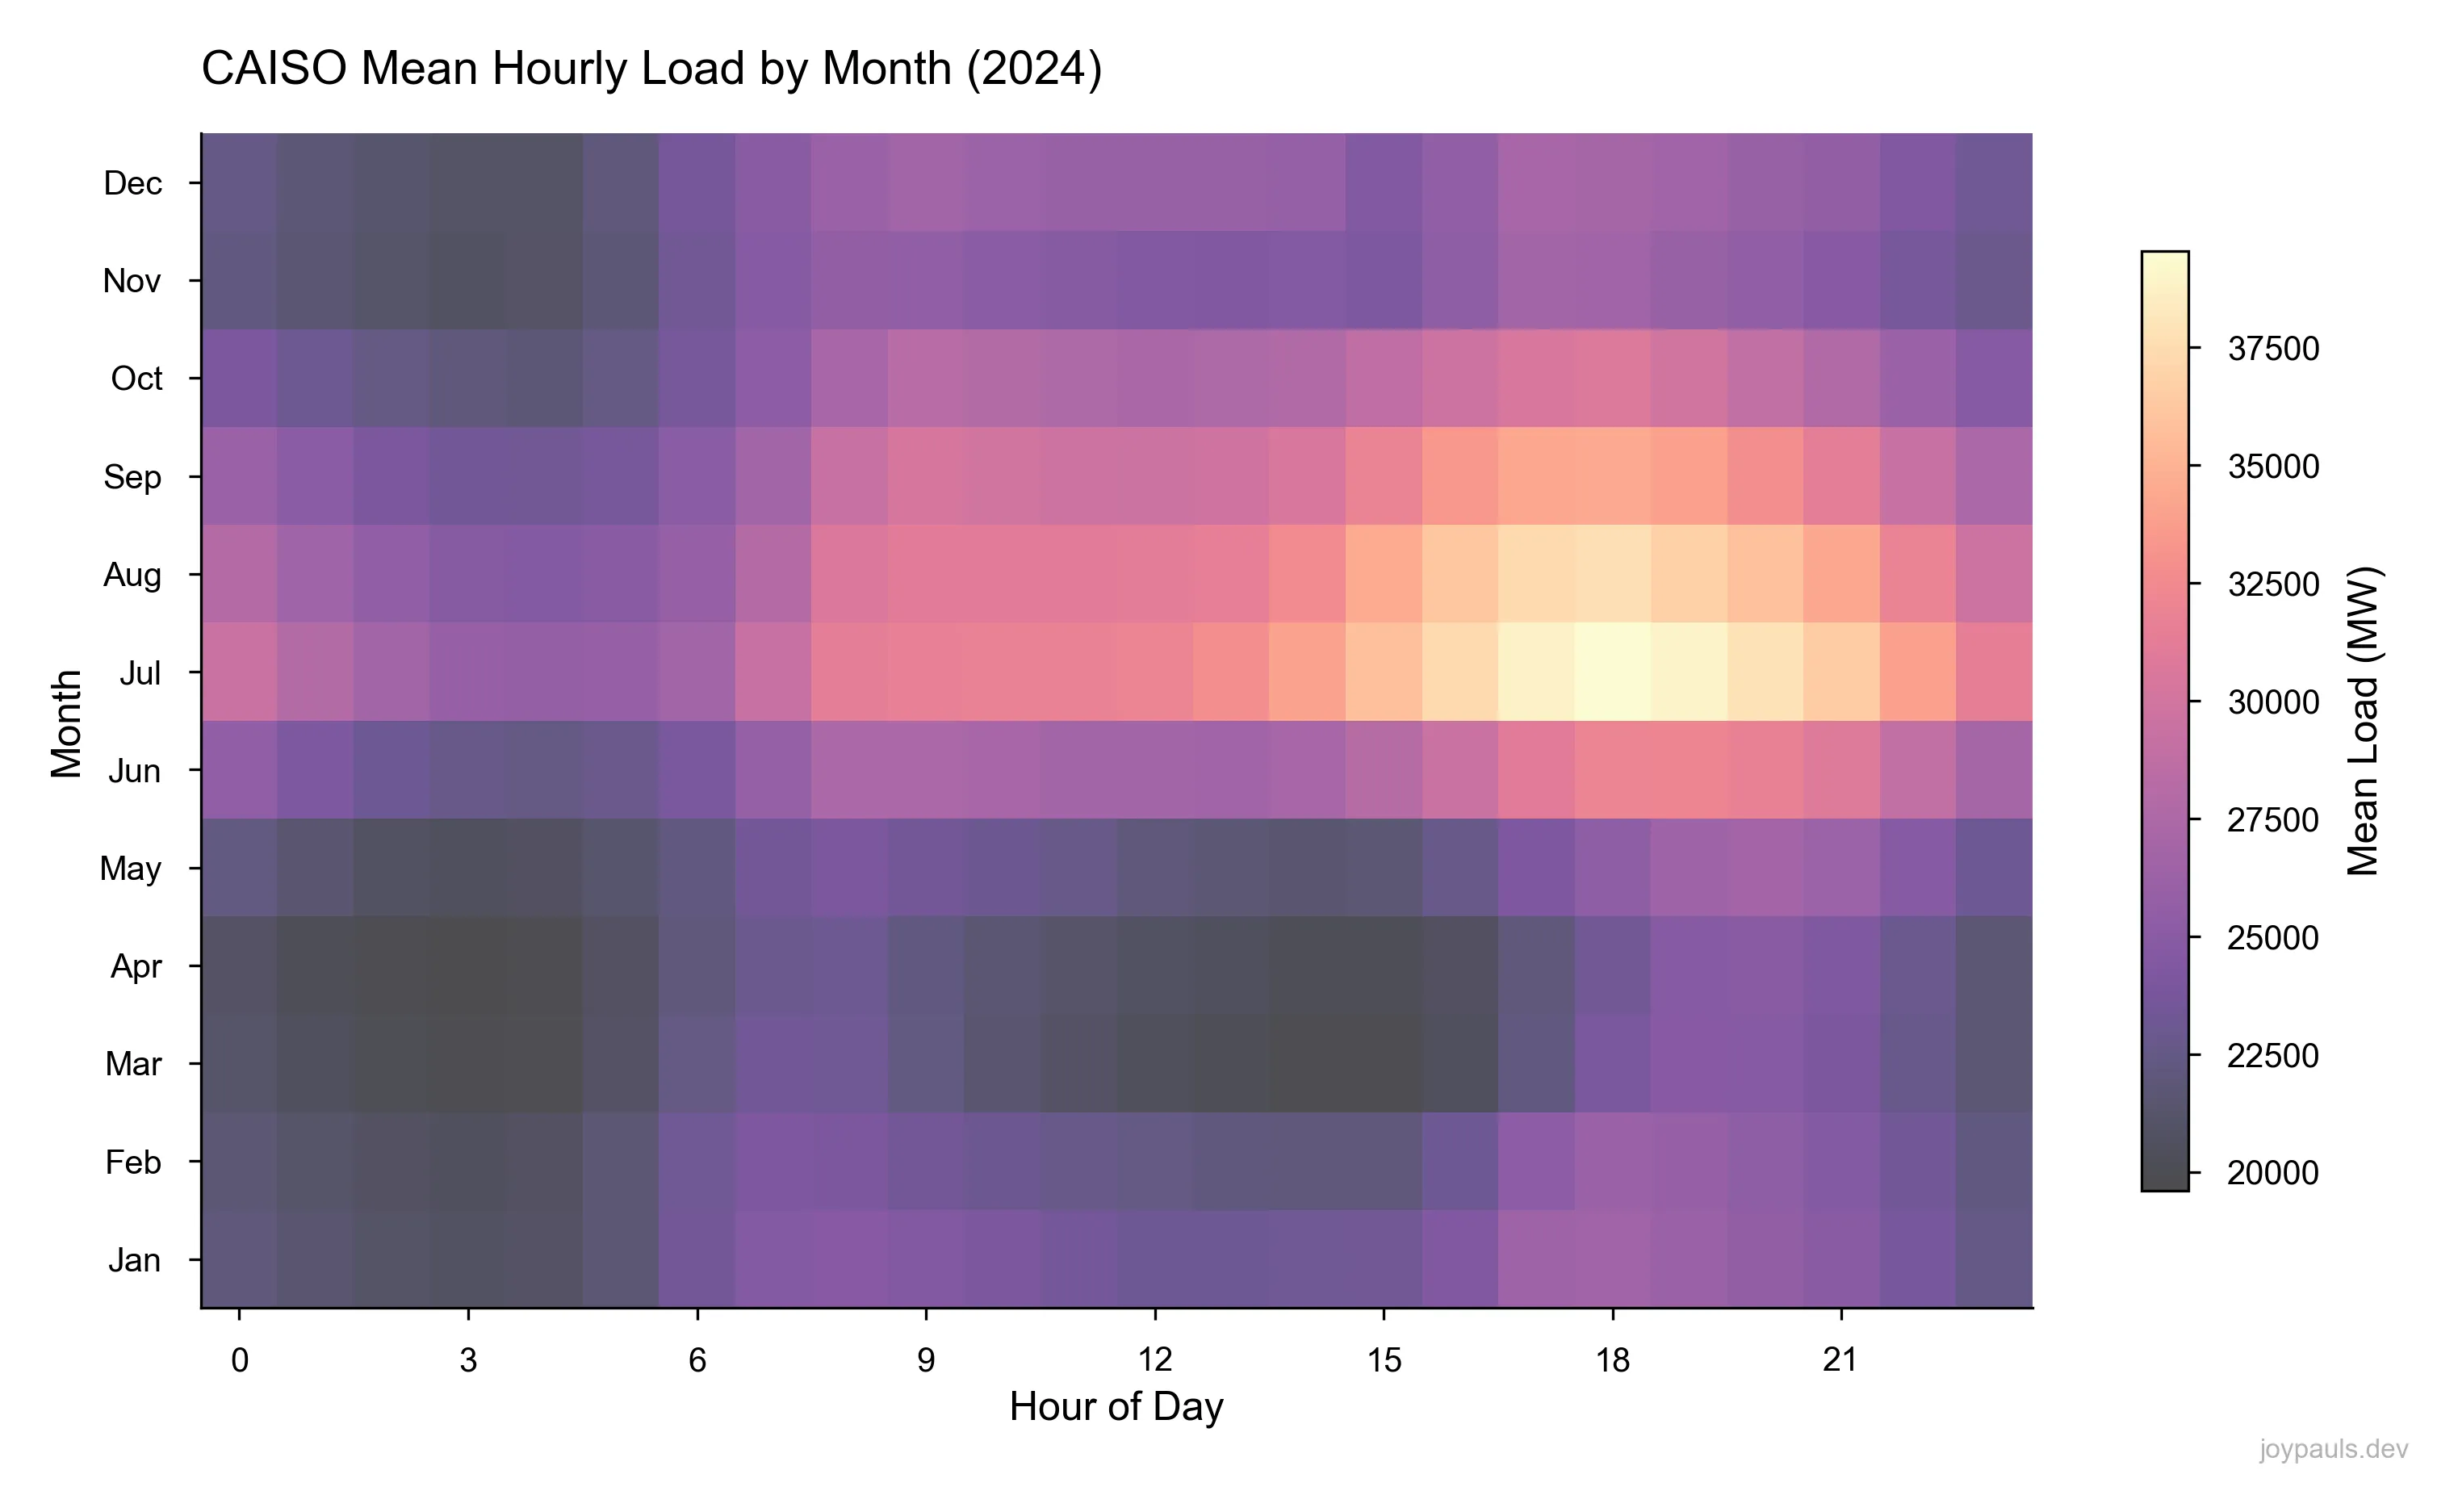
The highest average load seen throughout the year in 2024 occurred in July at 6 P.M. This makes intuitive sense: two observations we’ve already made, the effects of high summer temperatures and evening load peaking when workers return home, come together to put significant stress on the grid. On the flip side, the lowest average load at 3 A.M. in March is due to minimal overnight usage during a mild-weather period with little need for heating or cooling.
Into the Future
As California’s grid evolves, these patterns won’t stay static. Several major forces are driving structural change across the country:
- Prosumers and Distributed Energy Resources (DERs): households, businesses, and small-scale systems that generate, store, and consume electricity (e.g. rooftop solar)
- Large-scale energy storage: limited temporal decoupling of supply and demand
- Smart meters and demand response: enabling dynamic management of electricity use at the household level
As these technologies transform grid operations, the ability to interpret demand patterns and forecast future load accurately will remain critical for reliability and for enabling deeper decarbonization. Open data from ISOs like CAISO helps us understand the past and build tools that can support a smarter, cleaner grid.
Data Source
If you’d like to dig into this data yourself, you can find it here.